Introduction
Hyperautomation works. The evidence is clear, consistent, and growing: organizations that implement it well are reporting 20 to 40 percent cost reductions, 40 percent faster process cycle times, and — according to research cited across multiple analyst reports — three-year ROI figures as high as 330%, with payback periods as short as six months on well-chosen deployments.
And yet, fewer than 20 percent of large enterprises say they have genuinely mastered the measurement and governance of their hyperautomation initiatives. The majority are investing significant budget in automation technology without a robust framework for proving — to themselves, to their boards, or to their CFOs — exactly what that investment is delivering.
This is not a technology problem. It is a measurement and communication problem. And it is one that matters enormously, because automation programs that cannot prove their value do not get funded to grow. The organizations that win with hyperautomation are not just the ones that build the best bots — they are the ones that build the best measurement systems. Here is an excellent starting point for your Hyperautomation Strategy.
This article gives you a complete framework for measuring hyperautomation ROI: the metrics that matter, the benchmarks to set your expectations against, the common measurement mistakes to avoid, and — critically — how to communicate the value story in a way that resonates with leadership and secures continued investment.
Why Measuring Hyperautomation ROI Is Harder Than It Looks
At first glance, automation ROI seems straightforward. You measure how long a process took before automation, how long it takes after, multiply the difference by the volume and the labor cost, and you have your answer.
In practice, it is considerably more complex — for three reasons.
The first is that hyperautomation delivers value across multiple dimensions simultaneously. It reduces cost. It improves speed. It increases accuracy. It frees employees to do higher-value work. It improves the customer experience. It reduces compliance risk. Each of these value streams is real, but they require different measurement approaches, and some — like employee engagement and strategic capacity — resist easy quantification. An ROI framework that captures only the labor-cost dimension is measuring a fraction of the actual return.
The second is that hyperautomation value compounds over time in ways that point-in-time measurements miss. A machine learning model that processes invoices at 85% accuracy on day one learns from experience and reaches 96% accuracy after six months of production operation. Process mining identifies new automation candidates continuously, expanding the program’s scope. Reusable components built for one use case accelerate the development of the next ten. These compounding effects are real and significant, but they do not show up in a measurement framework that only looks at the initial deployment.
Read more on 10 Real World Examples of Hyperautomation By Inducstry
The third is that hyperautomation changes the nature of work rather than simply reducing headcount — and most ROI models are built around headcount reduction. When automation handles routine tasks, employees shift to higher-value activities: exception handling, process improvement, strategic analysis, customer relationship management. The value of this redeployment is substantial but harder to capture than a straightforward FTE reduction calculation.
An effective ROI framework accounts for all three of these dimensions — breadth, compounding, and redeployment value — rather than defaulting to a narrow labor-cost model.
The Measurement Foundation: Baseline Before You Automate
The single most important rule in automation measurement is one that is consistently violated in practice: you cannot prove value without a rigorous baseline.
Before any automation goes live, document the current state of every process in the program with the following data points.
Processing volume — how many transactions, cases, or items does the process handle per month, quarter, and year? Volume is the multiplier that turns small per-unit improvements into large aggregate savings.
Processing time — how long does it take, on average, to complete one unit of the process from trigger to resolution? Measure end-to-end elapsed time (including waiting time between steps) as well as active handling time. Both matter and they often differ dramatically.
Error rate — what percentage of process outputs contain errors, require rework, or are returned for correction? Error rates are frequently underestimated in self-reported assessments; wherever possible, derive them from system data rather than estimates.
Cost per transaction — what is the fully loaded cost of processing one unit of the process manually? This should include direct labor cost (salary, benefits, overhead burden), error correction costs, and any downstream costs caused by delays or inaccuracies.
Straight-through processing rate — what percentage of cases complete the process without requiring manual intervention? If the answer is zero before automation, that is your baseline. If some level of straight-through processing already exists, it is important to measure the incremental improvement automation delivers.
Employee time allocation — how much of the relevant employees’ time is currently consumed by the tasks being automated? This establishes the opportunity for redeployment and is critical for quantifying the strategic capacity value of automation.
Document all of these figures rigorously, with sources and dates, before automation goes live. The organization that fails to do this baseline work will have no credible answer when leadership asks, six months later, what the program has delivered.
The Five Value Dimensions of Hyperautomation ROI
A complete hyperautomation ROI framework captures value across five distinct dimensions. Together, they give a far more accurate and persuasive picture of program value than any single metric can provide.
1. Efficiency Value: Speed and Volume
Efficiency value is the most immediately visible dimension of automation ROI. It captures the improvement in processing speed and the ability to handle higher volume without proportional cost increases.
Key metrics for efficiency value:
- Cycle time reduction: the percentage decrease in end-to-end process completion time
- Throughput increase: the increase in the number of transactions processed per period at equivalent or lower cost
- Straight-through processing rate: the percentage of cases that complete without human intervention, measured post-automation against the pre-automation baseline
- Bot utilization rate: the percentage of available bot capacity that is actively processing work — a key indicator of whether the automation is deployed and performing as intended
Benchmark context: well-designed hyperautomation deployments consistently achieve 40 to 70 percent reductions in process cycle time on high-volume workflows. Straight-through processing rates of 70 to 80 percent are achievable on standard process types within the first year of deployment.
2. Cost Value: Direct Financial Savings
Cost value translates efficiency gains into financial terms. It is the dimension that CFOs and finance committees care most about and the one that most directly justifies continued program investment.
Key metrics for cost value:
- Cost per transaction reduction: the decrease in fully loaded cost per unit of process output
- Total labor cost avoided: the aggregate cost of manual processing that has been replaced by automation, calculated as (volume × cost per transaction reduction)
- Error correction cost avoided: the cost of rework, corrections, and downstream impacts of errors that automation has eliminated
- Penalty and compliance cost avoided: in regulated environments, the cost of compliance failures, late payments, or audit findings that better process accuracy and auditability prevents
Benchmark context: accounts payable automation benchmarks reported in 2026 show manual invoice processing costs of $8 to $15 per invoice dropping to $1 to $3 with AI-powered automation — a cost reduction of 70 to 85 percent per transaction. At scale across a large enterprise processing 50,000 invoices per month, the annual saving from this single use case can reach several million dollars.
3. Quality Value: Accuracy and Compliance
Quality value captures the improvement in process accuracy and the reduction in compliance risk that hyperautomation delivers. This dimension is particularly significant in regulated industries — financial services, healthcare, insurance, pharmaceuticals — where error rates and compliance failures carry direct financial penalties as well as reputational consequences.
Key metrics for quality value:
- Error rate reduction: the decrease in the percentage of process outputs that contain errors or require rework
- Audit finding reduction: the decrease in compliance findings, deficiencies, or exceptions identified in audits following automation deployment
- Audit trail completeness: the percentage of automated transactions for which a complete, timestamped audit trail is automatically captured — a metric that is increasingly scrutinized by regulators
- Regulatory penalty avoidance: where quantifiable, the financial value of compliance failures prevented by automation
Quality value is often underweighted in ROI models because it is harder to quantify than direct cost savings. But in regulated industries, a single significant compliance failure can cost more than an entire year’s automation program budget — which means the risk reduction value of automation is very real, even when it is difficult to assign a precise dollar figure.
4. Strategic Capacity Value: Redeployment and Growth
Strategic capacity value captures the value created when automation frees skilled employees from routine tasks and enables them to apply their time and expertise to higher-value activities.
Key metrics for strategic capacity value:
- Employee hours redeployed: the total number of employee hours per month that have shifted from automated tasks to higher-value activities
- Employee redeployment rate: the percentage of the redeployed hours that have been directed to demonstrably higher-value work — a metric that requires qualitative assessment as well as time tracking
- New capability enabled: documentation of specific business initiatives, analyses, or improvements that were not previously possible because the relevant employees were consumed by manual processing
This dimension requires a different kind of measurement — qualitative as well as quantitative — but it is often where the most compelling value stories are found. The finance analyst who spent 60% of her time on manual data entry and now leads a strategic forecasting project. The HR team that used to spend two weeks processing onboarding paperwork for every new hire and now focuses entirely on talent development. These stories resonate with leadership in ways that cost-per-transaction numbers alone do not.
5. Customer Experience Value
Customer experience value captures the impact of automation on the quality and speed of service delivery to internal and external customers. It is the dimension most closely linked to revenue outcomes and brand equity.
Key metrics for customer experience value:
- Customer-facing process cycle time: the reduction in time from customer request to resolution for automated customer-facing workflows
- Customer satisfaction scores (CSAT/NPS): the change in satisfaction metrics following automation of customer-facing processes
- First-contact resolution rate: the percentage of customer interactions resolved without escalation or follow-up, in processes where automation handles the initial response
- Service availability: the extension of service hours enabled by automation — particularly relevant for global organizations where manual processes were limited to business hours in a single time zone
Customer experience value is the dimension that is most likely to connect hyperautomation investment to revenue outcomes, making it particularly important for organizations in customer-facing industries where retention, loyalty, and acquisition are directly influenced by service quality.
The ROI Calculation Framework
With baseline data captured and the five value dimensions defined, you are ready to build a structured ROI calculation. The basic formula is:
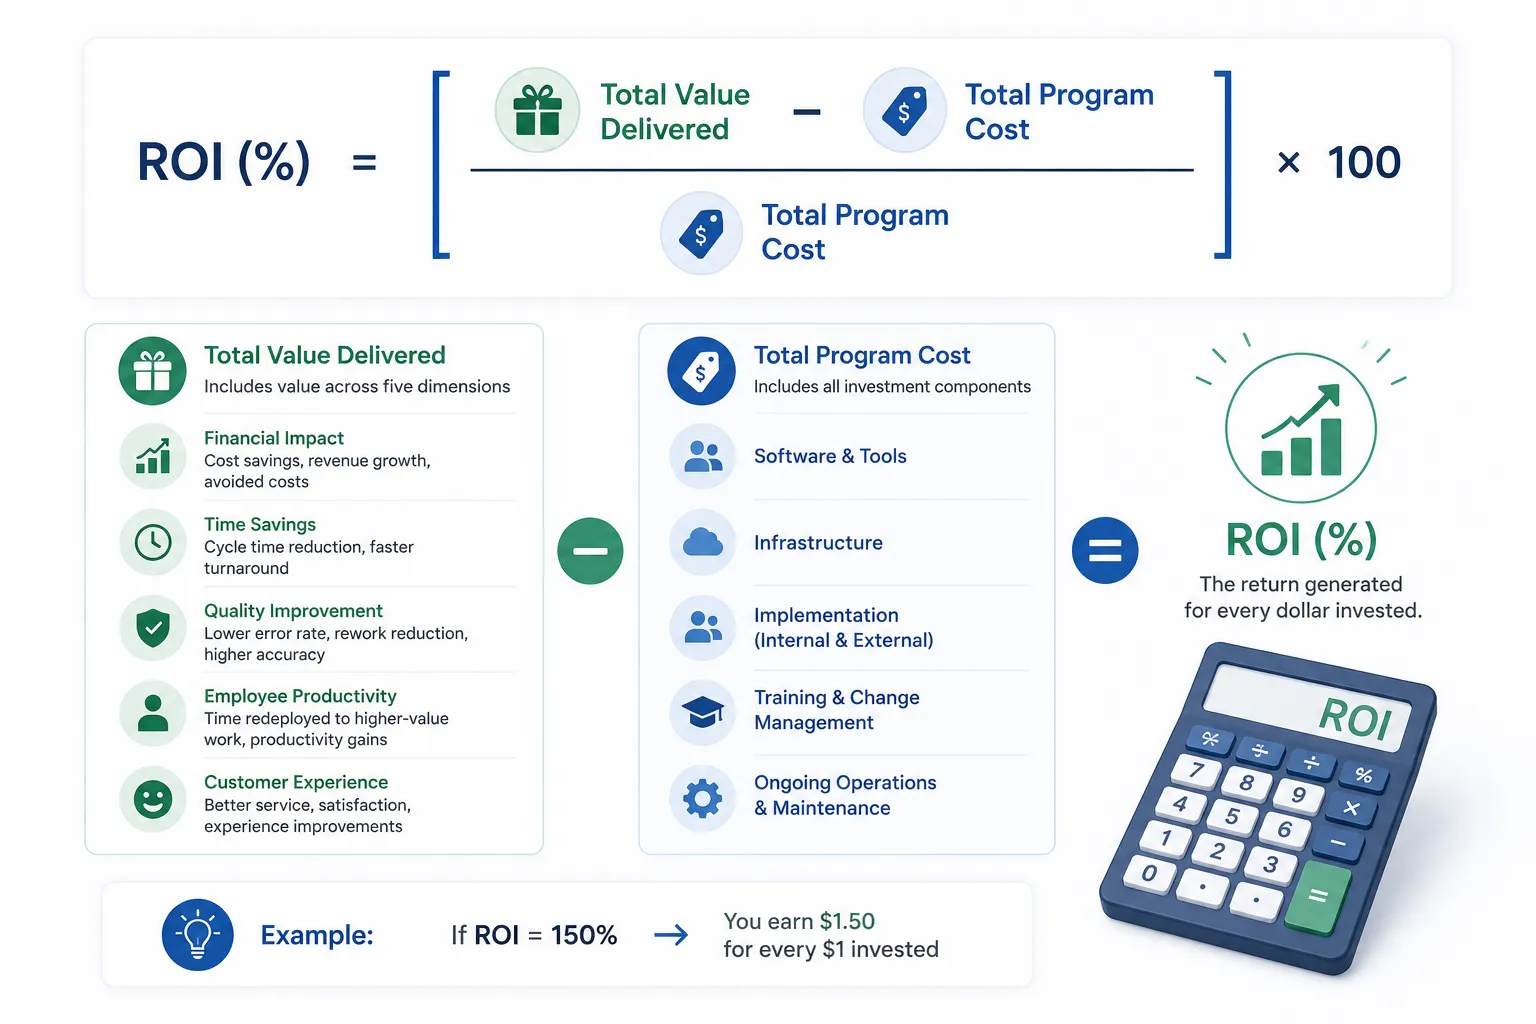
ROI (%) = [(Total Value Delivered − Total Program Cost) ÷ Total Program Cost] × 100
Total value delivered is the sum of quantified value across all five dimensions over the measurement period — typically the first 12 to 24 months post-deployment.
Total program cost is the fully loaded cost of the automation program, including platform licensing, implementation and development costs (internal labor and external professional services), infrastructure costs, training, change management, and ongoing maintenance.
A critical point: many organizations undercount their program costs by excluding internal labor, training, and change management investment. This produces an inflated ROI figure that loses credibility when scrutinized. A complete cost calculation that includes all investment components produces a more defensible and ultimately more trusted result.
For payback period calculation:
Payback Period (months) = Total Program Cost ÷ Monthly Value Delivered
Industry benchmarks for well-executed hyperautomation programs in 2026 show average payback periods of three to six months on high-volume, high-suitability process deployments, and six to twelve months for more complex, cross-functional implementations. Programs reporting 330% three-year ROI are not outliers — they reflect what disciplined execution against genuinely high-value processes delivers. For detailed ROI formulas, department-level benchmarks, and a tracking framework applicable across automation platforms, Automation Atlas’s workflow automation ROI benchmarks guide for 2026 provides one of the most comprehensive public references available.
Building Your Measurement Dashboard
Effective ROI measurement is not a one-time exercise. It is an ongoing operational discipline that produces the continuous evidence needed to sustain leadership confidence and program funding over time.
A hyperautomation measurement dashboard should operate at two levels.
At the process level, the dashboard tracks real-time performance metrics for each deployed automation: transaction volume, cycle time, straight-through processing rate, exception rate, bot uptime and utilization, and cost per transaction. This data is the operational heartbeat of the automation program — it tells you whether each automation is performing as designed, flags issues before they escalate, and provides the raw material for continuous improvement decisions.
At the program level, the dashboard tracks cumulative value delivery across the entire portfolio: total hours saved, total cost avoided, total error reduction, aggregate ROI against investment, and pipeline of automation initiatives in development. This is the executive view — the data that answers the question “is our hyperautomation program delivering the value we invested in it to deliver?”
Most modern hyperautomation platforms include built-in analytics dashboards that capture process-level metrics automatically. The program-level view typically requires additional work to build — aggregating data across deployments, mapping it to financial metrics, and presenting it in a format that is meaningful to non-technical stakeholders.
Invest in building this program-level dashboard before you need it. The organizations that are most successful at sustaining automation investment over time are those that can walk into any budget conversation with a clean, credible, up-to-date picture of program ROI — not a set of anecdotes and estimates assembled under pressure.
Common Measurement Mistakes to Avoid
Even well-intentioned measurement programs make predictable mistakes that undermine their credibility and usefulness.
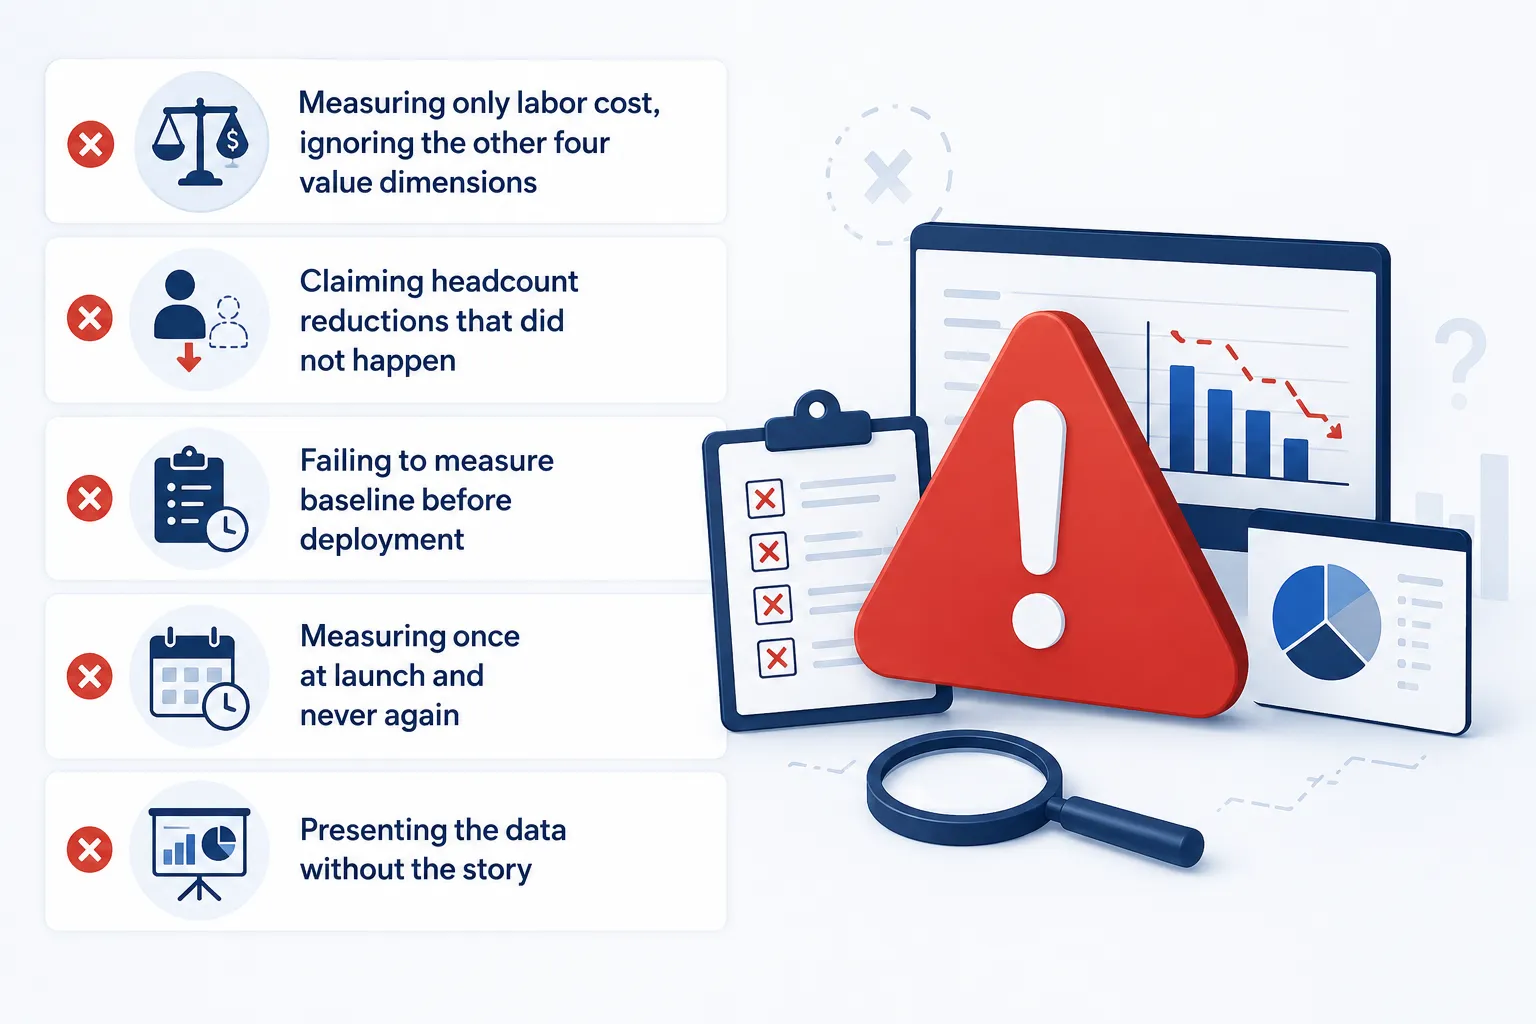
Measuring only labor cost, ignoring the other four value dimensions. Labor cost savings are real and important, but they represent a fraction of hyperautomation’s total value. A framework that ignores quality, speed, strategic capacity, and customer experience is systematically underreporting ROI — which paradoxically makes it harder to justify the investment, not easier.
Claiming headcount reductions that did not happen. One of the most common credibility-destroying mistakes in automation ROI reporting is claiming FTE savings based on hours automated rather than actual headcount changes. If 500 hours per month are automated but no employees are made redundant, the ROI model should reflect the redeployment value of those hours — not a phantom headcount reduction. Leadership will verify these claims, and inflated projections damage the program’s credibility far more than accurate, conservative estimates would.
Failing to measure baseline before deployment. You cannot retrospectively establish a rigorous baseline after automation has gone live. If you skipped this step, your ROI claims will always be based on estimates rather than measured fact — and they will be challenged accordingly.
Measuring once at launch and never again. Hyperautomation value compounds over time. Process mining identifies new opportunities. Machine learning models improve their accuracy. Reusable components accelerate new deployments. A measurement framework that only captures the initial deployment results is missing the compounding value that makes hyperautomation a genuinely transformational investment rather than a one-time efficiency project.
Presenting the data without the story. Numbers alone rarely move leadership to action. The most effective ROI presentations combine quantitative metrics with specific, concrete examples of the impact automation has had on real processes, real customers, and real employees. The CFO wants to see the cost-per-transaction reduction; the CEO wants to understand what the organization can now do that it could not do before. Both need to be part of the communication.
How to Present ROI to Leadership
The mechanics of measurement are only half the challenge. The other half is communicating the results in a way that sustains leadership confidence and secures ongoing investment.
A compelling ROI presentation to a CFO or board covers three areas in sequence.
First, the investment and return: what the program has cost to date, what it has delivered in quantified financial terms, and what the current ROI and payback period figures are. Use conservative assumptions and show your methodology — a credible, well-documented calculation that slightly undersells the result is far more persuasive than an aggressive one that invites challenge.
Second, the operational evidence: specific examples of processes automated, before-and-after comparisons, and notable outcomes — a compliance audit passed cleanly for the first time, a customer service metric that improved measurably after automation, a finance team that completed month-end close two days faster. These concrete examples translate abstract ROI numbers into business reality.
Third, the forward case: the pipeline of automation initiatives in development, the projected ROI of the next phase, and the compounding value that continued investment will deliver. This is the growth narrative — the argument that the program is not a sunk cost but a platform for ongoing value creation that justifies continued and increasing investment.
For additional context on how leading organizations are structuring their 2026 ROI conversations with leadership, the InfoSeeMedia analysis of the 2026 state of hyperautomation provides a comprehensive reference that includes analyst-sourced ROI benchmarks and practical guidance on measurement best practices.
Conclusion
Hyperautomation ROI is real, substantial, and measurable — but it is not automatic. The organizations that prove the value of their automation programs and secure continued investment to scale them are those that invest in measurement as seriously as they invest in the technology itself.
The framework in this article gives you everything you need to do that: a rigorous baseline process, a five-dimensional value model that captures the full breadth of automation’s impact, a structured ROI calculation methodology, a measurement dashboard operating at both process and program level, and a communication approach that translates data into the kind of compelling value story that moves leadership to action.
Fewer than 20 percent of large enterprises have truly mastered this. The organizations that do have a decisive advantage — not just in justifying their current automation investment, but in building the organizational confidence and funding runway needed to scale hyperautomation from a collection of efficiency projects into a genuine competitive differentiator.
The technology delivers the value. The measurement system proves it. Both are non-negotiable.