Introduction
Hyperautomation works. The evidence is clear, consistent, and growing: organizations that implement it well are reporting 20 to 40 percent cost reductions, 40 percent faster process cycle times, and — according to research cited across multiple analyst reports — three-year ROI figures as high as 330%, with payback periods as short as six months on well-chosen deployments.
And yet, fewer than 20 percent of large enterprises say they have genuinely mastered the measurement and governance of their hyperautomation initiatives. The majority are investing significant budget in automation technology without a robust framework for proving — to themselves, to their boards, or to their CFOs — exactly what that investment is delivering.
This is not a technology problem. It is a measurement and communication problem. And it is one that matters enormously, because automation programs that cannot prove their value do not get funded to grow. The organizations that win with hyperautomation are not just the ones that build the best bots — they are the ones that build the best measurement systems. Here is an excellent starting point for your Hyperautomation Strategy.
This article gives you a complete framework for measuring hyperautomation ROI: the metrics that matter, the benchmarks to set your expectations against, the common measurement mistakes to avoid, and — critically — how to communicate the value story in a way that resonates with leadership and secures continued investment.
Why Measuring Hyperautomation ROI Is Harder Than It Looks
At first glance, automation ROI seems straightforward. You measure how long a process took before automation, how long it takes after, multiply the difference by the volume and the labor cost, and you have your answer.
In practice, it is considerably more complex — for three reasons.
The first is that hyperautomation delivers value across multiple dimensions simultaneously. It reduces cost. It improves speed. It increases accuracy. It frees employees to do higher-value work. It improves the customer experience. It reduces compliance risk. Each of these value streams is real, but they require different measurement approaches, and some — like employee engagement and strategic capacity — resist easy quantification. An ROI framework that captures only the labor-cost dimension is measuring a fraction of the actual return.
The second is that hyperautomation value compounds over time in ways that point-in-time measurements miss. A machine learning model that processes invoices at 85% accuracy on day one learns from experience and reaches 96% accuracy after six months of production operation. Process mining identifies new automation candidates continuously, expanding the program’s scope. Reusable components built for one use case accelerate the development of the next ten. These compounding effects are real and significant, but they do not show up in a measurement framework that only looks at the initial deployment.
Read more on 10 Real World Examples of Hyperautomation By Inducstry
The third is that hyperautomation changes the nature of work rather than simply reducing headcount — and most ROI models are built around headcount reduction. When automation handles routine tasks, employees shift to higher-value activities: exception handling, process improvement, strategic analysis, customer relationship management. The value of this redeployment is substantial but harder to capture than a straightforward FTE reduction calculation.
An effective ROI framework accounts for all three of these dimensions — breadth, compounding, and redeployment value — rather than defaulting to a narrow labor-cost model.
The Measurement Foundation: Baseline Before You Automate
The single most important rule in automation measurement is one that is consistently violated in practice: you cannot prove value without a rigorous baseline.
Before any automation goes live, document the current state of every process in the program with the following data points.
Processing volume — how many transactions, cases, or items does the process handle per month, quarter, and year? Volume is the multiplier that turns small per-unit improvements into large aggregate savings.
Processing time — how long does it take, on average, to complete one unit of the process from trigger to resolution? Measure end-to-end elapsed time (including waiting time between steps) as well as active handling time. Both matter and they often differ dramatically.
Error rate — what percentage of process outputs contain errors, require rework, or are returned for correction? Error rates are frequently underestimated in self-reported assessments; wherever possible, derive them from system data rather than estimates.
Cost per transaction — what is the fully loaded cost of processing one unit of the process manually? This should include direct labor cost (salary, benefits, overhead burden), error correction costs, and any downstream costs caused by delays or inaccuracies.
Straight-through processing rate — what percentage of cases complete the process without requiring manual intervention? If the answer is zero before automation, that is your baseline. If some level of straight-through processing already exists, it is important to measure the incremental improvement automation delivers.
Employee time allocation — how much of the relevant employees’ time is currently consumed by the tasks being automated? This establishes the opportunity for redeployment and is critical for quantifying the strategic capacity value of automation.
Document all of these figures rigorously, with sources and dates, before automation goes live. The organization that fails to do this baseline work will have no credible answer when leadership asks, six months later, what the program has delivered.
The Five Value Dimensions of Hyperautomation ROI
A complete hyperautomation ROI framework captures value across five distinct dimensions. Together, they give a far more accurate and persuasive picture of program value than any single metric can provide.
1. Efficiency Value: Speed and Volume
Efficiency value is the most immediately visible dimension of automation ROI. It captures the improvement in processing speed and the ability to handle higher volume without proportional cost increases.
Key metrics for efficiency value:
- Cycle time reduction: the percentage decrease in end-to-end process completion time
- Throughput increase: the increase in the number of transactions processed per period at equivalent or lower cost
- Straight-through processing rate: the percentage of cases that complete without human intervention, measured post-automation against the pre-automation baseline
- Bot utilization rate: the percentage of available bot capacity that is actively processing work — a key indicator of whether the automation is deployed and performing as intended
Benchmark context: well-designed hyperautomation deployments consistently achieve 40 to 70 percent reductions in process cycle time on high-volume workflows. Straight-through processing rates of 70 to 80 percent are achievable on standard process types within the first year of deployment.
2. Cost Value: Direct Financial Savings
Cost value translates efficiency gains into financial terms. It is the dimension that CFOs and finance committees care most about and the one that most directly justifies continued program investment.
Key metrics for cost value:
- Cost per transaction reduction: the decrease in fully loaded cost per unit of process output
- Total labor cost avoided: the aggregate cost of manual processing that has been replaced by automation, calculated as (volume × cost per transaction reduction)
- Error correction cost avoided: the cost of rework, corrections, and downstream impacts of errors that automation has eliminated
- Penalty and compliance cost avoided: in regulated environments, the cost of compliance failures, late payments, or audit findings that better process accuracy and auditability prevents
Benchmark context: accounts payable automation benchmarks reported in 2026 show manual invoice processing costs of $8 to $15 per invoice dropping to $1 to $3 with AI-powered automation — a cost reduction of 70 to 85 percent per transaction. At scale across a large enterprise processing 50,000 invoices per month, the annual saving from this single use case can reach several million dollars.
3. Quality Value: Accuracy and Compliance
Quality value captures the improvement in process accuracy and the reduction in compliance risk that hyperautomation delivers. This dimension is particularly significant in regulated industries — financial services, healthcare, insurance, pharmaceuticals — where error rates and compliance failures carry direct financial penalties as well as reputational consequences.
Key metrics for quality value:
- Error rate reduction: the decrease in the percentage of process outputs that contain errors or require rework
- Audit finding reduction: the decrease in compliance findings, deficiencies, or exceptions identified in audits following automation deployment
- Audit trail completeness: the percentage of automated transactions for which a complete, timestamped audit trail is automatically captured — a metric that is increasingly scrutinized by regulators
- Regulatory penalty avoidance: where quantifiable, the financial value of compliance failures prevented by automation
Quality value is often underweighted in ROI models because it is harder to quantify than direct cost savings. But in regulated industries, a single significant compliance failure can cost more than an entire year’s automation program budget — which means the risk reduction value of automation is very real, even when it is difficult to assign a precise dollar figure.
4. Strategic Capacity Value: Redeployment and Growth
Strategic capacity value captures the value created when automation frees skilled employees from routine tasks and enables them to apply their time and expertise to higher-value activities.
Key metrics for strategic capacity value:
- Employee hours redeployed: the total number of employee hours per month that have shifted from automated tasks to higher-value activities
- Employee redeployment rate: the percentage of the redeployed hours that have been directed to demonstrably higher-value work — a metric that requires qualitative assessment as well as time tracking
- New capability enabled: documentation of specific business initiatives, analyses, or improvements that were not previously possible because the relevant employees were consumed by manual processing
This dimension requires a different kind of measurement — qualitative as well as quantitative — but it is often where the most compelling value stories are found. The finance analyst who spent 60% of her time on manual data entry and now leads a strategic forecasting project. The HR team that used to spend two weeks processing onboarding paperwork for every new hire and now focuses entirely on talent development. These stories resonate with leadership in ways that cost-per-transaction numbers alone do not.
5. Customer Experience Value
Customer experience value captures the impact of automation on the quality and speed of service delivery to internal and external customers. It is the dimension most closely linked to revenue outcomes and brand equity.
Key metrics for customer experience value:
- Customer-facing process cycle time: the reduction in time from customer request to resolution for automated customer-facing workflows
- Customer satisfaction scores (CSAT/NPS): the change in satisfaction metrics following automation of customer-facing processes
- First-contact resolution rate: the percentage of customer interactions resolved without escalation or follow-up, in processes where automation handles the initial response
- Service availability: the extension of service hours enabled by automation — particularly relevant for global organizations where manual processes were limited to business hours in a single time zone
Customer experience value is the dimension that is most likely to connect hyperautomation investment to revenue outcomes, making it particularly important for organizations in customer-facing industries where retention, loyalty, and acquisition are directly influenced by service quality.
The ROI Calculation Framework

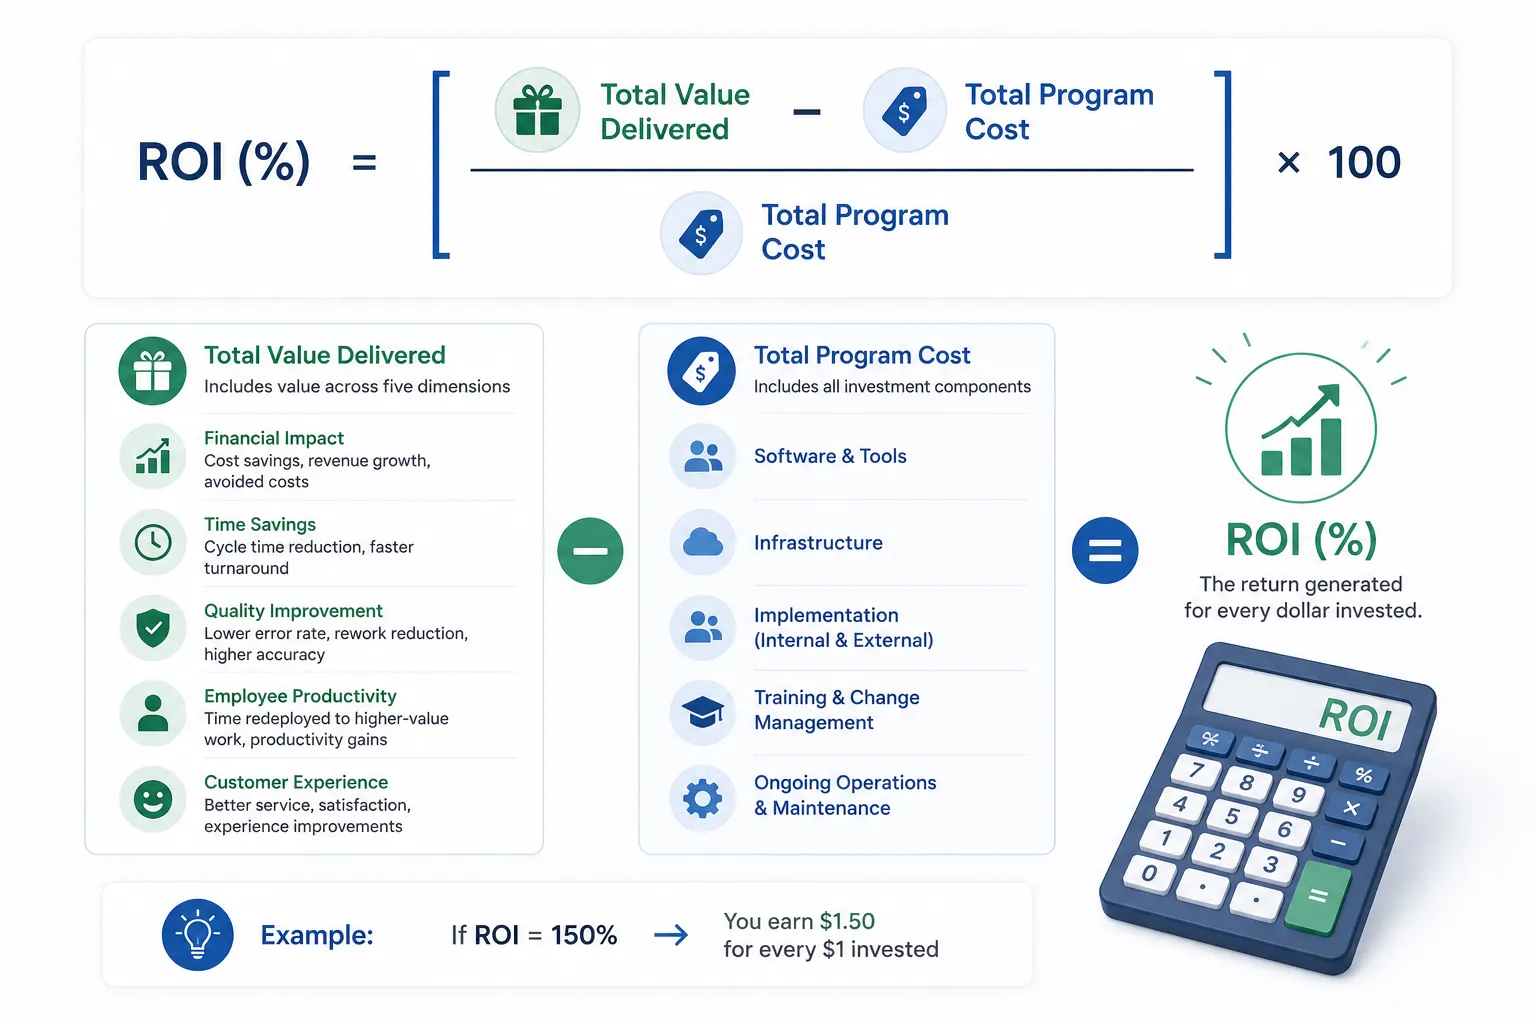
With baseline data captured and the five value dimensions defined, you are ready to build a structured ROI calculation. The basic formula is:
ROI (%) = [(Total Value Delivered − Total Program Cost) ÷ Total Program Cost] × 100
Total value delivered is the sum of quantified value across all five dimensions over the measurement period — typically the first 12 to 24 months post-deployment.
Total program cost is the fully loaded cost of the automation program, including platform licensing, implementation and development costs (internal labor and external professional services), infrastructure costs, training, change management, and ongoing maintenance.
A critical point: many organizations undercount their program costs by excluding internal labor, training, and change management investment. This produces an inflated ROI figure that loses credibility when scrutinized. A complete cost calculation that includes all investment components produces a more defensible and ultimately more trusted result.
For payback period calculation:
Payback Period (months) = Total Program Cost ÷ Monthly Value Delivered
Industry benchmarks for well-executed hyperautomation programs in 2026 show average payback periods of three to six months on high-volume, high-suitability process deployments, and six to twelve months for more complex, cross-functional implementations. Programs reporting 330% three-year ROI are not outliers — they reflect what disciplined execution against genuinely high-value processes delivers. For detailed ROI formulas, department-level benchmarks, and a tracking framework applicable across automation platforms, Automation Atlas’s workflow automation ROI benchmarks guide for 2026 provides one of the most comprehensive public references available.
Building Your Measurement Dashboard
Effective ROI measurement is not a one-time exercise. It is an ongoing operational discipline that produces the continuous evidence needed to sustain leadership confidence and program funding over time.
A hyperautomation measurement dashboard should operate at two levels.
At the process level, the dashboard tracks real-time performance metrics for each deployed automation: transaction volume, cycle time, straight-through processing rate, exception rate, bot uptime and utilization, and cost per transaction. This data is the operational heartbeat of the automation program — it tells you whether each automation is performing as designed, flags issues before they escalate, and provides the raw material for continuous improvement decisions.
At the program level, the dashboard tracks cumulative value delivery across the entire portfolio: total hours saved, total cost avoided, total error reduction, aggregate ROI against investment, and pipeline of automation initiatives in development. This is the executive view — the data that answers the question “is our hyperautomation program delivering the value we invested in it to deliver?”
Most modern hyperautomation platforms include built-in analytics dashboards that capture process-level metrics automatically. The program-level view typically requires additional work to build — aggregating data across deployments, mapping it to financial metrics, and presenting it in a format that is meaningful to non-technical stakeholders.
Invest in building this program-level dashboard before you need it. The organizations that are most successful at sustaining automation investment over time are those that can walk into any budget conversation with a clean, credible, up-to-date picture of program ROI — not a set of anecdotes and estimates assembled under pressure.
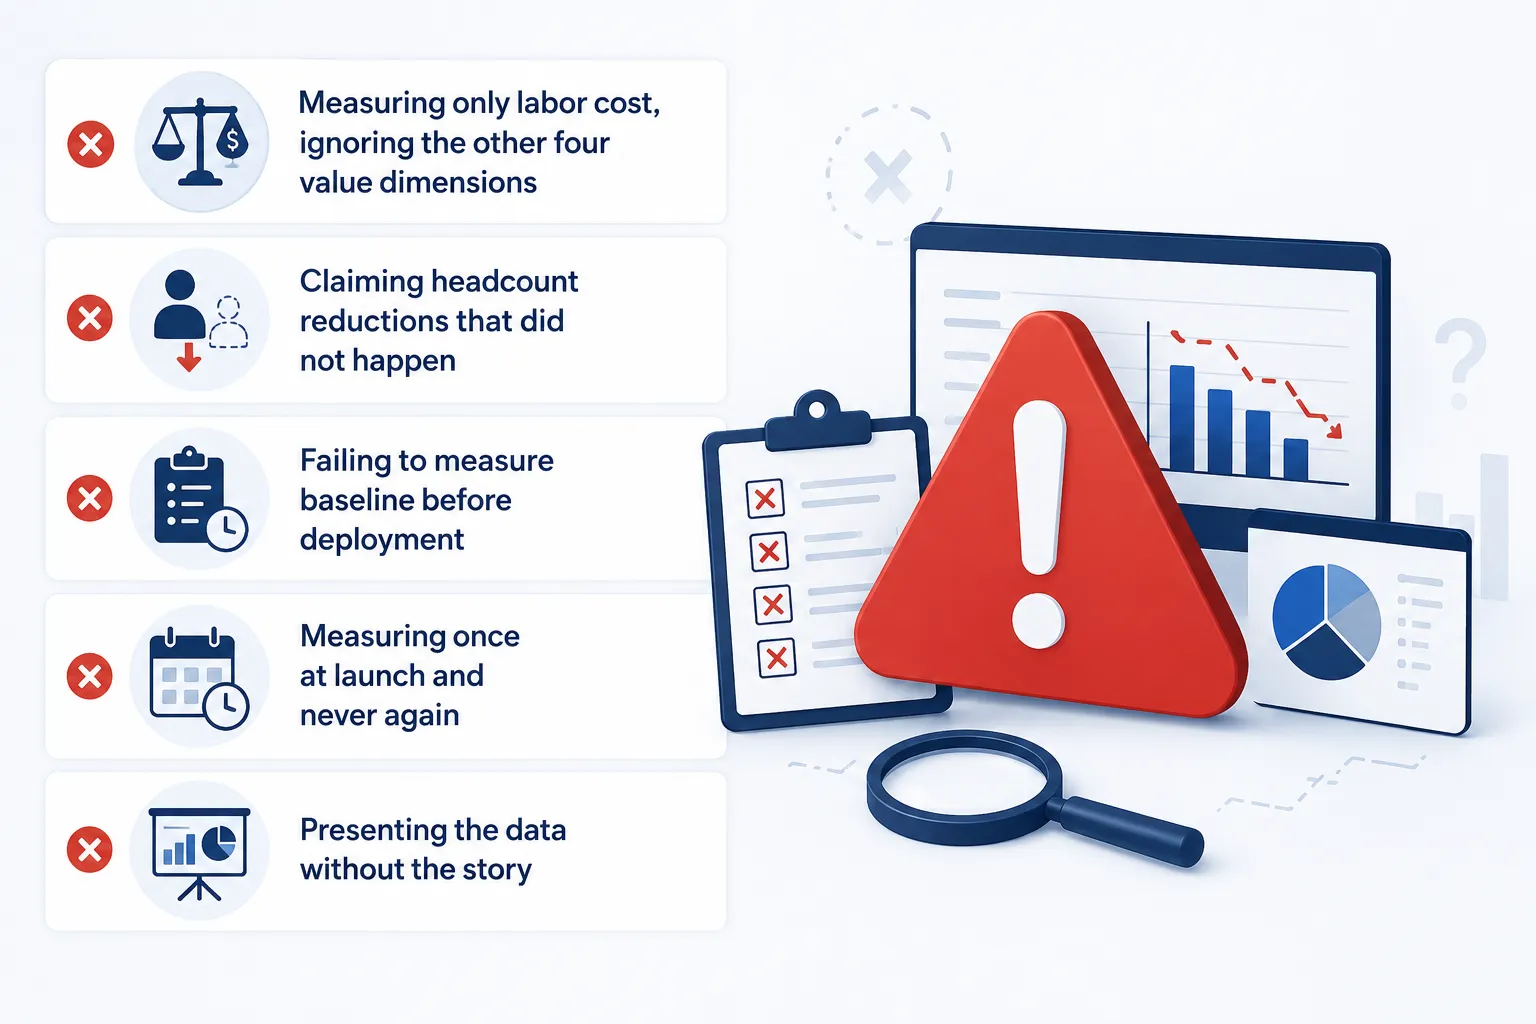
Common Measurement Mistakes to Avoid
Even well-intentioned measurement programs make predictable mistakes that undermine their credibility and usefulness.
Measuring only labor cost, ignoring the other four value dimensions. Labor cost savings are real and important, but they represent a fraction of hyperautomation’s total value. A framework that ignores quality, speed, strategic capacity, and customer experience is systematically underreporting ROI — which paradoxically makes it harder to justify the investment, not easier.
Claiming headcount reductions that did not happen. One of the most common credibility-destroying mistakes in automation ROI reporting is claiming FTE savings based on hours automated rather than actual headcount changes. If 500 hours per month are automated but no employees are made redundant, the ROI model should reflect the redeployment value of those hours — not a phantom headcount reduction. Leadership will verify these claims, and inflated projections damage the program’s credibility far more than accurate, conservative estimates would.
Failing to measure baseline before deployment. You cannot retrospectively establish a rigorous baseline after automation has gone live. If you skipped this step, your ROI claims will always be based on estimates rather than measured fact — and they will be challenged accordingly.
Measuring once at launch and never again. Hyperautomation value compounds over time. Process mining identifies new opportunities. Machine learning models improve their accuracy. Reusable components accelerate new deployments. A measurement framework that only captures the initial deployment results is missing the compounding value that makes hyperautomation a genuinely transformational investment rather than a one-time efficiency project.
Presenting the data without the story. Numbers alone rarely move leadership to action. The most effective ROI presentations combine quantitative metrics with specific, concrete examples of the impact automation has had on real processes, real customers, and real employees. The CFO wants to see the cost-per-transaction reduction; the CEO wants to understand what the organization can now do that it could not do before. Both need to be part of the communication.
How to Present ROI to Leadership
The mechanics of measurement are only half the challenge. The other half is communicating the results in a way that sustains leadership confidence and secures ongoing investment.
A compelling ROI presentation to a CFO or board covers three areas in sequence.
First, the investment and return: what the program has cost to date, what it has delivered in quantified financial terms, and what the current ROI and payback period figures are. Use conservative assumptions and show your methodology — a credible, well-documented calculation that slightly undersells the result is far more persuasive than an aggressive one that invites challenge.
Second, the operational evidence: specific examples of processes automated, before-and-after comparisons, and notable outcomes — a compliance audit passed cleanly for the first time, a customer service metric that improved measurably after automation, a finance team that completed month-end close two days faster. These concrete examples translate abstract ROI numbers into business reality.
Third, the forward case: the pipeline of automation initiatives in development, the projected ROI of the next phase, and the compounding value that continued investment will deliver. This is the growth narrative — the argument that the program is not a sunk cost but a platform for ongoing value creation that justifies continued and increasing investment.
For additional context on how leading organizations are structuring their 2026 ROI conversations with leadership, the InfoSeeMedia analysis of the 2026 state of hyperautomation provides a comprehensive reference that includes analyst-sourced ROI benchmarks and practical guidance on measurement best practices.
Conclusion
Hyperautomation ROI is real, substantial, and measurable — but it is not automatic. The organizations that prove the value of their automation programs and secure continued investment to scale them are those that invest in measurement as seriously as they invest in the technology itself.
The framework in this article gives you everything you need to do that: a rigorous baseline process, a five-dimensional value model that captures the full breadth of automation’s impact, a structured ROI calculation methodology, a measurement dashboard operating at both process and program level, and a communication approach that translates data into the kind of compelling value story that moves leadership to action.
Fewer than 20 percent of large enterprises have truly mastered this. The organizations that do have a decisive advantage — not just in justifying their current automation investment, but in building the organizational confidence and funding runway needed to scale hyperautomation from a collection of efficiency projects into a genuine competitive differentiator.
The technology delivers the value. The measurement system proves it. Both are non-negotiable.
Hyperautomation Content Series
Continue the Complete Hyperautomation Guide
This post is a part of the Hyperautomation Content Series — the complete 8 article guide to understanding, implementing, and scaling hyperautomation in your organization.
FAQs
Calculating hyperautomation ROI requires a structured framework that captures value across efficiency, cost, quality, strategic capacity, and customer experience, then compares total value delivered against fully loaded program costs using a clear formula.
Key Takeaways
- Always establish a quantified baseline of volume, time, error rates, and cost per transaction before automation begins.
- Measure five distinct value dimensions rather than relying only on labor cost reduction.
- Apply the standard ROI formula and track payback period in months for executive clarity.
- Include compounding effects and employee redeployment value for a complete picture.
- Communicate results with both hard numbers and strategic capacity stories that resonate with leadership.
Hyperautomation delivers measurable returns when organizations treat measurement as a core discipline rather than an afterthought. Organizations that implement it well report 20 to 40 percent cost reductions and 40 percent faster process cycle times. According to research cited across multiple analyst reports, three-year ROI figures reach as high as 330 percent, with payback periods as short as six months on well-chosen deployments. The challenge is that fewer than 20 percent of large enterprises have mastered the measurement and governance needed to prove that value consistently. Partnering with a dedicated development team for hyperautomation implementation helps close this gap by embedding measurement into the delivery process from day one.
This guide provides a practical, step-by-step method to calculate hyperautomation ROI accurately. It covers the baseline requirements, the five value dimensions that matter, the core formula, common pitfalls, and how to present results in a way that secures continued investment.
Why Accurate Measurement Matters More Than Technology
At first glance, automation ROI appears simple. Measure time before and after, multiply the difference by volume and labor cost, and you have a number. In practice the calculation is more complex for three reasons.
First, hyperautomation creates value across multiple dimensions at the same time. It reduces cost, improves speed, increases accuracy, frees employees for higher-value work, strengthens compliance, and often improves customer experience. A model that tracks only labor savings captures only a fraction of the return.
Second, value compounds. A machine learning model that starts at 85 percent accuracy can reach 96 percent after months of production data. Process mining continuously surfaces new automation candidates. Reusable components built for one process accelerate the next ten. Point-in-time measurements miss these effects.
Third, hyperautomation changes the nature of work rather than simply eliminating headcount. Employees shift from routine processing to exception handling, process improvement, analysis, and customer relationships. The value of that redeployment is real but harder to quantify than a straightforward FTE reduction.
An effective approach accounts for breadth, compounding, and redeployment rather than defaulting to a narrow labor-cost model. For a broader view of how these capabilities fit together, see our complete guide to hyperautomation.
Step 1: Build a Rigorous Baseline Before You Automate
The single most important rule is also the one most often violated: you cannot prove value without a credible baseline. Document the current state of every process in the program before any automation goes live. Capture these data points with sources and dates.
- Processing volume: transactions, cases, or items handled per month, quarter, and year.
- Processing time: average end-to-end elapsed time and active handling time per unit.
- Error rate: percentage of outputs that contain errors, require rework, or are returned. Prefer system data over estimates.
- Cost per transaction: fully loaded cost including direct labor, benefits, overhead, error correction, and downstream impact of delays.
- Straight-through processing rate: percentage of cases completed without manual intervention.
- Employee time allocation: share of relevant employees’ time currently consumed by the tasks targeted for automation.
Without these figures, leadership will have no credible answer six months later when they ask what the program has delivered. Organizations that skip this step routinely struggle to defend continued funding.
Step 2: Capture Value Across Five Dimensions
A complete hyperautomation ROI framework tracks five distinct dimensions. Together they provide a far more accurate and persuasive picture than any single metric.
- Efficiency Value: Speed and Volume
Key metrics include cycle time reduction, throughput increase, straight-through processing rate, and bot utilization rate. Well-designed deployments consistently achieve 40 to 70 percent reductions in process cycle time on high-volume workflows. Straight-through processing rates of 70 to 80 percent are achievable on standard process types within the first year.
- Cost Value: Direct Financial Savings
Translate efficiency gains into financial terms. Track cost per transaction reduction, total labor cost avoided, error correction cost avoided, and penalty or compliance cost avoided. Accounts payable benchmarks show manual invoice processing costs of $8 to $15 per invoice dropping to $1 to $3 with AI-powered automation, a 70 to 85 percent reduction per transaction. At scale this produces millions in annual savings.
- Quality Value: Accuracy and Compliance
Measure error rate reduction, audit finding reduction, audit trail completeness, and regulatory penalty avoidance where quantifiable. In regulated industries a single significant compliance failure can exceed an entire year’s automation program budget. Quality value is often underweighted because it is harder to quantify, yet it is frequently decisive.
- Strategic Capacity Value: Redeployment and Growth
Capture employee hours redeployed, the percentage of those hours directed to higher-value work, and specific new capabilities enabled. This dimension requires both quantitative tracking and qualitative documentation. The finance analyst who once spent 60 percent of her time on data entry and now leads strategic forecasting creates a compelling story that pure cost numbers cannot match.
- Customer Experience Value
Track customer-facing process cycle time, CSAT or NPS changes, first-contact resolution rate, and service availability improvements. This dimension most directly connects automation investment to revenue outcomes and brand equity.
Step 3: Apply the ROI Formula and Calculate Payback
With baseline data and the five value dimensions defined, calculate ROI using the standard formula:
ROI (%) = [(Total Value Delivered − Total Program Cost) ÷ Total Program Cost] × 100
Total value delivered is the sum of quantified value across all five dimensions over the measurement period, typically the first 12 to 24 months post-deployment.
Total program cost is the fully loaded cost of the automation program. Include platform licensing, implementation and development costs (internal labor and external services), infrastructure, training, change management, and ongoing maintenance.
Also calculate payback period for executive clarity:
Payback Period (months) = Total Program Cost ÷ Monthly Value Delivered
Industry benchmarks for well-executed programs show average payback periods of three to six months on high-volume, high-suitability process deployments and six to twelve months for more complex cross-functional implementations.
| Value Dimension | Primary Metrics | Typical Impact Range |
| Efficiency | Cycle time, throughput, STP rate | 40–70% cycle time reduction |
| Cost | Cost per transaction, labor avoided, error costs | 70–85% cost reduction on high-volume processes |
| Quality | Error rate, audit findings, penalty avoidance | Significant risk reduction in regulated industries |
| Strategic Capacity | Hours redeployed, new capabilities enabled | Highest long-term strategic value |
| Customer Experience | Cycle time, CSAT/NPS, first-contact resolution | Direct link to revenue and retention |
Once the framework is clear, the next practical step is applying it to your specific processes with the right expertise and tools. Many organizations find that translating the five dimensions into live dashboards and reliable baselines is faster and more accurate when supported by experienced partners.
Common Measurement Mistakes to Avoid
Several recurring errors undermine credibility. Measuring only labor cost savings ignores the majority of value. Failing to establish a baseline before go-live makes later claims unprovable. Treating one-time implementation costs as annual recurring costs distorts the picture. Ignoring adoption rates and exception volumes leads to overstated benefits. Finally, presenting pure numbers without the strategic capacity narrative leaves executives unconvinced even when the math is sound.
Building a clear measurement system from the start is easier when the overall program is guided by a solid foundation. Our guide on how to build a hyperautomation strategy shows how to align measurement with strategy and governance from day one.
How to Present Results That Secure Continued Investment
Leadership responds to both precision and narrative. Lead with the ROI percentage and payback period. Support them with the five value dimensions broken into clear metrics. Include one or two concrete redeployment stories that illustrate strategic capacity. Show the trajectory of compounding improvements rather than a single snapshot. Finally, contrast the fully loaded program cost against the cumulative value delivered and the risk of under-investing relative to competitors who are already scaling.
Organizations that treat hyperautomation ROI measurement as a core operating discipline consistently outperform those that treat it as a post-implementation reporting exercise. The technology works. The measurement system determines whether the program receives the sustained investment required to scale.
Final Thoughts
Stop leaving value unproven. Partner with Bantech to build a hyperautomation program that delivers measurable results and communicates them with clarity. Contact us today to map your highest-ROI opportunities and establish the measurement foundation that turns automation investments into board-level success stories.
The average ROI for well-executed hyperautomation programs reaches 200 to 330 percent over three years, with payback periods commonly falling between three and twelve months. First-year returns on high-volume processes often range from 100 to 400 percent depending on process suitability, implementation quality, and measurement discipline.
Key Takeaways
- Typical three-year ROI for mature hyperautomation programs sits between 200 and 330 percent.
- Payback periods average three to six months on high-volume processes and six to twelve months for broader programs.
- RPA alone often delivers 30 to 200 percent first-year ROI; full hyperautomation compounds higher.
- Results vary widely by process selection, baseline quality, adoption rates, and governance.
- Organizations that measure across multiple value dimensions consistently report stronger returns than those tracking only labor savings.
Organizations investing in hyperautomation want clear expectations. What returns are realistic? How quickly do they appear? The answers depend on execution, yet consistent benchmarks have emerged across analyst reports and enterprise deployments. Partnering with specialists who deliver enterprise process automation solutions helps teams set accurate targets and avoid the wide performance gaps that separate leaders from laggards.
This article outlines the average and typical ROI ranges for hyperautomation, intelligent automation, and RPA. It breaks down the numbers by time horizon and process type, explains the factors that push results higher or lower, and shows how leading organizations consistently achieve the upper end of the range.
Benchmark Ranges for Hyperautomation ROI
Analyst data and enterprise case studies converge on a set of practical ranges. Organizations that implement hyperautomation well report 20 to 40 percent cost reductions and 40 percent faster process cycle times. Three-year ROI figures frequently reach 200 to 330 percent, with some programs exceeding that when high-volume, high-suitability processes form the core of the portfolio. Payback periods of six months or less appear regularly on well-chosen deployments.
RPA, as a foundational technology within the broader hyperautomation stack, typically produces lower but still attractive returns on its own. First-year ROI for mature RPA programs commonly falls between 30 and 200 percent. When RPA is combined with process mining, intelligent document processing, machine learning, and orchestration, the compounding effects push overall program returns into the higher range associated with full hyperautomation.
These figures are not guarantees. They represent outcomes achieved by organizations that select the right processes, establish rigorous baselines, drive adoption, and measure value across multiple dimensions rather than labor cost alone.
Typical Payback Periods and First-Year Returns
Payback period often matters more to finance leaders than the multi-year ROI percentage. On high-volume transactional processes such as invoice processing, claims handling, or customer onboarding, payback within three to six months is common. Broader, cross-functional programs that involve more complex integrations and change management typically show payback in six to twelve months.
First-year ROI varies more widely. Conservative programs focused on a handful of stable processes may report 100 to 200 percent. Aggressive programs that automate multiple high-volume workflows and capture efficiency, quality, and capacity gains often reach 250 to 400 percent or higher in year one. The difference usually traces back to process selection quality and the completeness of the measurement model.
For concrete illustrations of these returns in action, review real deployments across industries in our collection of hyperautomation examples by industry.
What Drives Higher or Lower Returns
Several controllable factors explain most of the variance in reported ROI.
Process suitability ranks first. High-volume, rules-based processes with clear exception paths and measurable cost or risk deliver the strongest returns. Low-volume or highly variable processes rarely justify the investment on pure financial grounds.
Baseline quality ranks second. Organizations that document volume, cycle time, error rates, and fully loaded cost per transaction before automation begins can prove value. Those that skip this step often understate returns or lose credibility with leadership.
Adoption and exception handling rank third. Automations that run at high utilization with low exception rates generate far more value than those that remain underused or require frequent human intervention.
Measurement scope ranks fourth. Programs that track only labor hours saved consistently report lower ROI than those that also quantify error reduction, compliance risk avoidance, employee capacity redeployment, and customer experience improvements.
Technology and architecture choices also matter. Platforms that support reusable components, strong orchestration, and continuous process discovery enable faster expansion of the automation portfolio and higher cumulative returns. Evaluating these capabilities carefully is essential, as outlined in our comparison of leading hyperautomation platforms.
| Category | Typical First-Year ROI | Typical Payback | Three-Year ROI Range |
| Standalone RPA (high-volume) | 30–200% | 6–12 months | 100–250% |
| Intelligent Automation | 100–300% | 4–9 months | 200–350% |
| Full Hyperautomation Program | 150–400%+ | 3–8 months | 200–330%+ |
| Cross-functional Enterprise | 100–250% | 6–12 months | 200–300% |
Industry and Maturity Variations
Results also differ by industry and organizational maturity. Financial services, insurance, and healthcare often see strong returns because of high transaction volumes and regulatory pressure that amplifies the value of accuracy and auditability. Manufacturing and logistics programs frequently excel on cycle-time and throughput metrics. Professional services and knowledge-work environments tend to realize more of their value through capacity redeployment than pure cost reduction.
Maturity plays an equally large role. Organizations in the early stages of automation usually focus on isolated processes and report modest but positive returns. Those that have built centers of excellence, standardized development practices, and continuous discovery capabilities consistently move into the upper end of the benchmark ranges. The difference is less about the technology and more about operating model discipline.
Setting Realistic Expectations for Your Organization
The safest way to set expectations is to start with a small portfolio of high-suitability processes, establish clean baselines, and measure across the full set of value dimensions. Early wins in the 100 to 250 percent first-year range build credibility and fund expansion. Over time, compounding effects from reusable assets, improved process discovery, and higher employee capacity push cumulative returns toward the 200 to 330 percent three-year benchmarks reported by leading programs.
Avoid the common trap of quoting the highest published numbers without reference to the conditions that produced them. The 330 percent three-year figures come from organizations that selected the right processes, measured thoroughly, and scaled systematically. Programs that skip those steps land well below the average.
Final Thoughts
Typical hyperautomation ROI is strong when the fundamentals are in place: the right processes, rigorous baselines, multi-dimensional measurement, and disciplined scaling. Organizations that treat these elements as non-negotiable routinely achieve returns that justify continued investment and create lasting competitive advantage.
Ready to benchmark your own opportunities against these ranges and build a program designed for measurable results?
Contact Bantech today to discuss your priority processes and develop a clear ROI roadmap tailored to your organization.
Most well-executed hyperautomation projects achieve payback within three to twelve months. High-volume, high-suitability processes commonly deliver positive ROI in three to six months, while broader cross-functional programs typically require six to twelve months.
Key Takeaways
- High-volume transactional processes often reach payback in three to six months.
- Complex or cross-functional programs typically show payback in six to twelve months.
- First measurable efficiency gains can appear within weeks of go-live when baselines are solid.
- Process selection, adoption rates, and measurement discipline are the strongest predictors of speed.
- Organizations that track multi-dimensional value reach positive ROI faster than those focused only on labor savings.
Speed to value is one of the most common questions executives ask before approving hyperautomation investment. The answer is encouraging for the right processes and disciplined execution. Organizations that select high-suitability workflows and measure rigorously routinely see positive returns well inside the first year. Teams that begin with thorough business process analysis and optimization services set clearer expectations and reduce the risk of delayed payback.
This article explains typical payback periods for hyperautomation projects, the factors that accelerate or slow returns, realistic timelines by project type, and practical steps to reach positive ROI faster.
Typical Payback Period Ranges
Industry benchmarks for well-executed hyperautomation programs show average payback periods of three to six months on high-volume, high-suitability process deployments. Broader programs that span multiple functions or require deeper system integration commonly achieve payback in six to twelve months.
These figures align with broader analyst observations. Programs reporting strong three-year ROI of around 330 percent frequently cite payback periods as short as six months on carefully chosen initial deployments. The key distinction is between focused, high-volume use cases and enterprise-wide initiatives.
Early operational improvements often appear sooner than full financial payback. Cycle-time reductions, error-rate improvements, and straight-through processing gains are frequently visible within the first 30 to 90 days after go-live when a solid baseline exists. Full financial recovery of program costs takes longer because it depends on sustained volume, adoption, and the cumulative impact of multiple value dimensions.
Factors That Determine How Quickly ROI Appears
Several controllable variables explain most of the difference between fast and slow payback.
Process selection exerts the largest influence. High-volume, rules-based processes with clear exception paths and measurable unit costs generate returns quickly. Invoice processing, claims intake, order management, and employee onboarding frequently reach payback in under six months. Low-volume or highly variable processes extend the timeline and may never achieve attractive payback on pure cost grounds.
Baseline quality ranks next. Organizations that document volume, cycle time, error rates, and fully loaded cost per transaction before automation begins can demonstrate value as soon as the new process stabilizes. Those that skip the baseline struggle to prove returns even when operational improvements are real.
Adoption and exception management also matter. Automations that achieve high utilization and low exception rates produce value continuously. Programs that launch with incomplete change management or unclear exception handling often see delayed or partial returns.
Measurement scope affects perceived speed. Teams that track only labor hours saved may wait longer to show positive ROI. Those that also quantify error reduction, compliance risk avoidance, capacity redeployment, and customer experience improvements reach a positive cumulative figure sooner.
Technology architecture influences the trajectory as well. Platforms that support reusable components and strong orchestration allow subsequent automations to be delivered faster and at lower marginal cost, accelerating overall program payback. Understanding the core technology stack helps teams design for speed, as detailed in our overview of core technologies powering hyperautomation.
Realistic Timelines by Project Type
Different project profiles produce different payback patterns.
Focused high-volume process automation (for example, accounts payable invoice processing) frequently reaches payback in three to six months. Measurable efficiency gains often appear within the first month.
Intelligent automation that combines RPA with document processing or basic machine learning typically falls in the four to nine month range, depending on data quality and exception volumes.
Broader departmental or cross-functional programs that involve multiple systems and stakeholder groups commonly require six to twelve months. These initiatives often deliver higher cumulative value but take longer to reach financial break-even.
Enterprise-scale programs with heavy governance and multi-year roadmaps may show partial returns in the first year while full program payback extends beyond twelve months. Early focused wins inside the larger program are still expected to pay back quickly and fund continued expansion.
| Project Type | Typical Payback Period | First Visible Gains | Key Success Factors |
| High-volume single process | 3–6 months | 30–60 days | Clean baseline, high volume |
| Intelligent document / claims | 4–9 months | 45–90 days | Data quality, exception design |
| Departmental multi-process | 6–12 months | 60–120 days | Adoption, reuse of components |
| Cross-functional / enterprise | 8–15 months | 90+ days | Governance, phased rollout |
How to Accelerate Time to Positive ROI
Organizations that consistently achieve the faster end of the ranges follow a repeatable pattern.
They begin with a short list of high-suitability processes rather than attempting broad transformation immediately. They invest the time to capture accurate baselines before any automation goes live. They design exception handling and human-in-the-loop steps carefully so that early production performance is reliable. They measure across efficiency, cost, quality, and capacity dimensions from the first reporting cycle. Finally, they treat the initial deployments as both value generators and learning platforms that reduce the cost and risk of subsequent automations.
Clear measurement frameworks make these gains visible and defensible. For detailed guidance on capturing the full value picture, refer to our framework on how to measure and prove hyperautomation ROI.
Avoid the common mistakes that extend payback: launching without baselines, underestimating change management, selecting processes with low volume or high variability, and reporting only partial value metrics.
Final Thoughts
Payback periods of three to twelve months are realistic for most hyperautomation projects when process selection, baseline discipline, and multi-dimensional measurement are treated as non-negotiable. High-volume focused initiatives routinely reach positive ROI in under six months, while broader programs still deliver attractive returns inside the first year. The organizations that move fastest combine the right starting processes with rigorous measurement and a clear scaling path.
Contact Bantech today to evaluate your highest-potential processes, establish clean baselines, and build a hyperautomation roadmap designed for rapid, measurable payback.
The most effective metrics for measuring hyperautomation ROI span five value dimensions: efficiency (cycle time, throughput, straight-through processing rate), cost (cost per transaction, labor avoided), quality (error rate, audit findings), strategic capacity (hours redeployed), and customer experience (CSAT, first-contact resolution).
Key Takeaways
- Track metrics across five dimensions rather than relying on a single labor-cost figure.
- Efficiency KPIs such as cycle time reduction and straight-through processing rate provide early, visible proof of value.
- Cost and quality metrics convert operational gains into financial and risk-reduction language that finance and compliance leaders understand.
- Strategic capacity and customer experience metrics capture longer-term and revenue-linked benefits.
- Consistent baselines and regular reporting turn these KPIs into a credible ROI narrative.
Selecting the right metrics determines whether a hyperautomation program can prove its value or remains stuck in vague efficiency claims. Organizations that measure only hours saved routinely understate returns and struggle to secure ongoing funding. A complete set of KPIs covers the full range of benefits and gives leaders a clear, multi-dimensional view of performance. Teams that combine these indicators with strong data analytics and business intelligence capabilities turn raw operational data into board-ready ROI reporting.
This article details the essential metrics and KPIs for measuring hyperautomation ROI, organized by value dimension, with practical guidance on what each one reveals and how to use it.
Efficiency Metrics: Speed and Volume
Efficiency KPIs deliver the earliest and most visible signals of success. They answer the question of whether the automation is actually moving work faster and handling more volume without proportional cost increases.
Key metrics include:
- Cycle time reduction: percentage decrease in end-to-end process completion time.
- Throughput increase: rise in the number of transactions processed per period at equivalent or lower cost.
- Straight-through processing (STP) rate: percentage of cases that complete without human intervention, measured against the pre-automation baseline.
- Bot utilization rate: percentage of available bot capacity that is actively processing work.
Well-designed deployments consistently achieve 40 to 70 percent reductions in process cycle time on high-volume workflows. STP rates of 70 to 80 percent are realistic targets for standard process types within the first year. These metrics are especially useful in the first 30 to 90 days after go-live because they appear quickly and are easy to communicate.
Cost Metrics: Direct Financial Impact
Cost KPIs translate operational improvements into the language of finance. They form the core of most formal ROI calculations.
Essential indicators are:
- Cost per transaction reduction: decrease in the fully loaded cost of processing one unit.
- Total labor cost avoided: aggregate cost of manual processing replaced by automation.
- Error correction cost avoided: savings from reduced rework and downstream impacts of mistakes.
- Penalty and compliance cost avoided: financial impact of fewer late payments, audit findings, or regulatory issues.
Accounts payable benchmarks illustrate the potential scale: manual invoice processing costs of $8 to $15 per invoice often fall to $1 to $3 with intelligent automation, producing 70 to 85 percent unit cost reductions. At enterprise volumes these savings become material.
Quality and Compliance Metrics
Quality KPIs capture accuracy improvements and risk reduction. They carry particular weight in regulated industries where errors and compliance failures carry direct financial and reputational consequences.
Track these indicators:
- Error rate reduction: decrease in the percentage of process outputs that contain errors or require rework.
- Audit finding reduction: drop in compliance deficiencies or exceptions identified in audits.
- Audit trail completeness: percentage of automated transactions that automatically generate a complete, timestamped record.
- Regulatory penalty avoidance: where quantifiable, the financial value of compliance failures prevented.
Quality value is frequently underweighted because it is harder to assign a precise dollar figure than direct labor savings. Yet a single avoided compliance event can exceed an entire year’s automation budget, making these metrics strategically important.
Strategic Capacity Metrics: Redeployment Value
Strategic capacity KPIs measure the shift of human effort from routine tasks to higher-value work. This dimension often produces the most compelling leadership stories.
Core metrics include:
- Employee hours redeployed: total hours per month shifted away from automated tasks.
- Employee redeployment rate: percentage of those hours directed to demonstrably higher-value activities.
- New capability enabled: documentation of specific initiatives, analyses, or improvements that became possible only after capacity was freed.
These metrics require both quantitative tracking and qualitative evidence. The combination of hard numbers and concrete examples of elevated work creates a stronger narrative than cost figures alone.
Customer Experience Metrics
Customer experience KPIs link automation to service quality and, ultimately, revenue and retention outcomes.
Relevant indicators are:
- Customer-facing process cycle time: reduction in time from request to resolution.
- Customer satisfaction scores (CSAT or NPS): changes following automation of customer-facing workflows.
- First-contact resolution rate: percentage of interactions resolved without escalation or follow-up.
- Service availability: extension of service hours enabled by always-on automation.
These metrics are especially powerful in customer-facing industries where speed and consistency directly influence loyalty and acquisition.
| Value Dimension | Primary KPIs | Why It Matters |
| Efficiency | Cycle time, STP rate, throughput, bot utilization | Early, visible proof of operational impact |
| Cost | Cost per transaction, labor avoided, error costs | Core financial justification |
| Quality | Error rate, audit findings, audit trail | Risk reduction and compliance value |
| Strategic Capacity | Hours redeployed, redeployment rate, new capabilities | Long-term organizational leverage |
| Customer Experience | CSAT/NPS, cycle time, first-contact resolution | Revenue and brand connection |
How to Use These Metrics Effectively
Start with a complete baseline for every process before automation begins. Report the full set of KPIs on a consistent cadence rather than selectively highlighting favorable numbers. Pair quantitative results with brief qualitative examples of capacity redeployment or customer impact. Review trends over time so compounding improvements become visible. Finally, align the metric set with the organization’s strategic priorities so that the ROI story resonates with both operational and executive audiences.
Modern automation programs benefit from AI-enhanced development and monitoring practices that make continuous KPI tracking more practical. Insights from AI-powered software development approaches can help teams embed measurement into the solution architecture itself.
Organizations that adopt this multi-dimensional KPI framework move beyond simple efficiency claims and build a durable, credible case for continued investment in hyperautomation.
Final Thoughts
The right metrics turn hyperautomation from a technology initiative into a measurable business program. By tracking efficiency, cost, quality, strategic capacity, and customer experience with clear, consistent KPIs, organizations gain the visibility needed to prove value, refine execution, and scale with confidence.
Ready to define the right KPI set for your processes and build reporting that leadership trusts? Contact us to start the conversation and map a measurement approach tailored to your goals.
Measuring hyperautomation ROI is harder than it looks because value appears across multiple dimensions at once, compounds over time in ways point-in-time metrics miss, and often comes from employee redeployment rather than simple headcount reduction. Traditional labor-cost models capture only a fraction of the true return.
Key Takeaways
- Hyperautomation delivers simultaneous gains in cost, speed, quality, capacity, and customer experience that single-metric models miss.
- Value compounds through learning models, process discovery, and reusable components that baseline comparisons often overlook.
- Most of the strategic benefit comes from shifting people to higher-value work rather than eliminating roles.
- Incomplete baselines, narrow metric sets, and weak adoption tracking are the most common sources of under-reported returns.
- Organizations that address these challenges with multi-dimensional frameworks consistently prove stronger, more credible ROI.
On the surface, automation ROI seems straightforward. Capture the time a process took before automation, measure the time it takes after, multiply the difference by volume and labor cost, and the result appears. In practice the calculation is considerably more complex. Fewer than 20 percent of large enterprises report that they have genuinely mastered measurement and governance of their hyperautomation initiatives. The gap is not primarily a technology problem. It is a measurement and communication problem. Organizations that begin with clear IT strategy development and planning support are better positioned to design measurement systems that match the true nature of the value being created.
This article examines the three core reasons measuring hyperautomation ROI is harder than it looks, the practical challenges that flow from them, and the approaches that leading organizations use to overcome those obstacles.
Challenge 1: Value Appears Across Multiple Dimensions Simultaneously
Hyperautomation rarely delivers a single type of benefit. The same deployment can reduce cost, compress cycle time, raise accuracy, free employee capacity, lower compliance risk, and improve customer experience. Each of these streams is real, yet each requires a different measurement approach.
A pure labor-cost model captures only one slice. Quality improvements and risk reduction are harder to quantify yet can be decisive in regulated industries. Customer experience gains may show up in retention or Net Promoter Score rather than immediate cost savings. Strategic capacity created by redeploying skilled people is often the largest long-term benefit and the least likely to appear in a simple spreadsheet.
When organizations track only the easiest metric, they systematically understate returns. Leadership then receives an incomplete picture and may under-invest relative to the actual opportunity.
Challenge 2: Value Compounds Over Time
Many of the most important gains from hyperautomation do not appear at the moment of go-live. A machine learning model that processes invoices at 85 percent accuracy on day one can reach 96 percent accuracy after six months of production data and feedback. Process mining tools continuously surface new automation candidates, expanding the program’s scope. Components built for one use case accelerate the development of the next ten. These compounding effects are substantial, but they are invisible to measurement frameworks that look only at the initial deployment window.
Point-in-time ROI calculations therefore tend to undervalue programs that are still early in their learning and reuse curve. Organizations that measure only the first three or six months often conclude that returns are modest, only to discover later that cumulative value has grown significantly.
Understanding the underlying technology layers that enable this compounding helps teams design measurement systems that capture it. Insights into the broader architecture appear in discussions of how modern platforms support continuous improvement and reuse.
Challenge 3: The Nature of Work Changes Rather Than Simply Shrinking
Most traditional ROI models were built around headcount reduction. Hyperautomation frequently produces a different outcome. Routine tasks move to automated systems, and employees shift into exception handling, process improvement, analysis, customer relationship work, or new initiatives that were previously impossible.
The economic value of this redeployment is real and often large. Yet it is harder to capture than a straightforward FTE reduction. It requires tracking how time is reallocated, assessing whether the new activities are genuinely higher value, and sometimes documenting entirely new capabilities that the organization can now pursue.
When measurement systems ignore redeployment and focus only on roles eliminated, they miss a major portion of the strategic return. The resulting narrative feels incomplete to both operational leaders and executives.
Additional Practical Obstacles
Beyond the three structural challenges, several operational issues frequently undermine measurement quality.
Incomplete or missing baselines make later claims unprovable. Teams that fail to document volume, cycle time, error rates, and fully loaded cost before automation begins have no credible reference point.
Inconsistent metric definitions across teams or time periods destroy comparability. What one group counts as an exception another may treat as successful automation.
Low adoption or high exception rates quietly erode projected benefits. An automation that runs at 40 percent utilization will never deliver the ROI calculated on 90 percent utilization assumptions.
Finally, reporting that focuses exclusively on positive numbers without acknowledging exceptions, maintenance effort, or ramp-up time loses credibility with finance and audit stakeholders.
| Core Challenge | Why It Distorts ROI | Practical Response |
| Multi-dimensional value | Single metrics capture only part of the return | Track five value dimensions consistently |
| Compounding effects | Early snapshots understate long-term gains | Measure trends over 12–24 months |
| Redeployment vs headcount reduction | Traditional models miss strategic capacity | Track hours shifted and new capabilities enabled |
| Weak baselines | Claims become unprovable | Document full process state before go-live |
| Incomplete adoption tracking | Projected benefits never fully materialize | Monitor utilization and exception rates |
How Leading Organizations Overcome the Challenges
Successful programs treat measurement as a design requirement rather than a reporting afterthought. They establish rigorous baselines before any automation is deployed. They define a balanced scorecard that covers efficiency, cost, quality, strategic capacity, and customer experience. They review trends over time so compounding effects become visible. They combine quantitative KPIs with concise qualitative examples of elevated work. And they align the entire measurement system with the organization’s broader strategic priorities so that the ROI story resonates at every level.
Partnerships that emphasize reusable delivery models and knowledge transfer can also reduce the friction of building these capabilities internally. Approaches such as white label partnership models sometimes help organizations accelerate both execution and measurement maturity.
The technology of hyperautomation works. The organizations that consistently prove its value are those that design measurement systems sophisticated enough to match the multi-dimensional, compounding, and transformative nature of the returns.
Final Thoughts
Measuring hyperautomation ROI is harder than a simple before-and-after calculation because the value itself is richer and more dynamic than traditional models assume. Organizations that confront the multi-dimensional, compounding, and redeployment realities head-on build credible, durable cases for continued investment. Those that rely on narrow labor-cost metrics leave substantial value unproven and risk under-funding programs that are actually performing well.
Contact us to discuss how to design a measurement approach that captures the full picture of hyperautomation returns and turns operational gains into a clear strategic narrative.
Beyond direct cost savings, the key value dimensions of hyperautomation ROI are efficiency (speed and volume gains), quality and compliance improvements, strategic capacity created through employee redeployment, and enhanced customer experience. Together these dimensions often outweigh pure labor-cost reduction in long-term impact.
Key Takeaways
- Efficiency gains in cycle time and throughput deliver early, visible operational value.
- Quality and compliance improvements reduce risk and rework costs that pure cost models frequently miss.
- Strategic capacity from redeploying skilled employees to higher-value work is often the largest long-term benefit.
- Customer experience improvements connect automation directly to revenue, retention, and brand outcomes.
- A complete ROI picture requires tracking all five dimensions rather than cost alone.
Cost reduction is the most familiar and easiest-to-quantify benefit of hyperautomation. Yet organizations that measure only labor savings systematically understate the true return. The strongest programs generate value across multiple dimensions at the same time. Teams that approach measurement with disciplined project management and implementation services are better equipped to capture the full range of benefits and present a more compelling case to leadership.
This article outlines the key value dimensions of hyperautomation ROI beyond pure cost savings, explains why each matters, and shows the practical metrics that make them measurable.
Efficiency Value: Speed and Volume
Efficiency is usually the first non-cost dimension to appear after go-live. Automation compresses end-to-end process times and increases the volume of work that can be handled without proportional increases in headcount or cost.
Primary metrics include cycle time reduction, throughput increase, straight-through processing rate, and bot utilization. Well-designed deployments consistently achieve 40 to 70 percent reductions in process cycle time on high-volume workflows. Straight-through processing rates of 70 to 80 percent are realistic within the first year on standard process types.
These gains matter because speed improves responsiveness to customers and internal stakeholders while throughput creates capacity that can absorb growth without linear cost increases. Efficiency metrics also provide early proof points that build confidence while longer-term dimensions mature.
Quality and Compliance Value
Quality improvements reduce errors, rework, and compliance exposure. In regulated industries these benefits can exceed the value of direct labor savings.
Key metrics are error rate reduction, audit finding reduction, audit trail completeness, and quantifiable regulatory penalty avoidance. Automation executes rules consistently, eliminates fatigue-related mistakes, and automatically generates complete audit records. A single avoided compliance event can outweigh an entire year of program costs, making this dimension strategically critical even when precise dollar figures are harder to assign.
Organizations that ignore quality value often undervalue automation in precisely the environments where risk reduction matters most.
Strategic Capacity Value: Redeployment and Growth
Strategic capacity is frequently the highest-leverage dimension and the one most poorly captured by traditional ROI models. When automation removes routine work, skilled employees shift to exception handling, process improvement, analysis, customer relationships, or entirely new initiatives.
Relevant metrics include total employee hours redeployed, the percentage of those hours directed to higher-value activities, and documentation of new capabilities that became possible only after capacity was freed. The finance analyst who previously spent most of her time on data entry and now leads forecasting projects, or the HR team that moves from paperwork to talent development, creates value that pure headcount-reduction math cannot express.
This dimension requires both quantitative tracking and qualitative storytelling. The combination resonates strongly with leadership because it demonstrates that automation expands organizational capability rather than simply shrinking the workforce.
Customer Experience Value
Customer experience improvements link hyperautomation directly to revenue and brand outcomes. Faster resolution times, higher first-contact resolution rates, improved satisfaction scores, and extended service availability all influence retention, loyalty, and acquisition.
Metrics to track include customer-facing process cycle time, CSAT or NPS changes, first-contact resolution rate, and service availability gains. In customer-centric industries these indicators often provide the clearest connection between automation investment and top-line results.
Even internal process automation can improve employee experience, which in turn supports better external service delivery.
How the Dimensions Work Together
A complete hyperautomation ROI framework treats cost savings as one of five interconnected dimensions rather than the sole measure of success. Efficiency gains frequently drive both cost reduction and better customer experience. Quality improvements reduce downstream costs while strengthening compliance posture. Strategic capacity enables new initiatives that generate future revenue or further efficiency. Customer experience gains reinforce the business case with commercial outcomes.
Programs that measure only cost produce incomplete and often unconvincing narratives. Programs that track the full set generate a richer, more durable justification for continued investment and scaling.
Modern delivery approaches that emphasize structured implementation and clear governance help organizations operationalize these dimensions from the outset. Broader technology and consulting perspectives, including those related to cloud computing strategy and migration and website and software development consulting, can further support the systems and processes needed to capture multi-dimensional value reliably.
| Value Dimension | Core Focus | Primary Metrics | Typical Strategic Weight |
| Efficiency | Speed and volume | Cycle time, STP rate, throughput | High (early proof) |
| Quality & Compliance | Accuracy and risk reduction | Error rate, audit findings, penalty avoidance | High (especially regulated industries) |
| Strategic Capacity | Employee redeployment and new capabilities | Hours redeployed, higher-value work rate, new initiatives | Often highest long-term |
| Customer Experience | Service quality and commercial impact | CSAT/NPS, resolution time, first-contact resolution | High (revenue-linked) |
| Cost | Direct financial savings | Cost per transaction, labor avoided | Foundational but incomplete alone |
Final Thoughts
Cost savings remain important, yet they represent only one part of the hyperautomation value equation. Efficiency, quality, strategic capacity, and customer experience frequently deliver equal or greater long-term impact. Organizations that measure and communicate all five dimensions build stronger, more credible cases for investment and create a clearer path to scaling.
Contact us to map the full set of value dimensions for your priority processes and design a measurement approach that captures the complete return.
Proving hyperautomation value to leadership, the board, and CFOs requires a clear multi-dimensional ROI narrative that combines hard financial metrics with strategic capacity and risk-reduction outcomes, supported by rigorous baselines, consistent tracking, and concise storytelling that links automation results to enterprise priorities.
Key Takeaways
- Lead with ROI percentage, payback period, and cumulative value rather than technical details.
- Present the full set of value dimensions so cost savings are never the only story.
- Pair quantitative results with specific redeployment and business-impact examples.
- Address common executive concerns about risk, adoption, maintenance, and scalability upfront.
- Maintain a simple, consistent reporting cadence that builds credibility over time.
Executives and boards fund what they can understand, trust, and connect to strategic priorities. Hyperautomation programs that remain stuck in operational metrics or technical language rarely secure sustained investment. Programs that translate results into a clear value narrative do. Organizations that combine strong delivery with disciplined audit and compliance services are better positioned to produce the governance and evidence trail that finance and board stakeholders expect.
This article outlines a practical approach to proving and communicating hyperautomation value to leadership, the board, and CFOs. It covers the structure of an executive-ready narrative, the metrics that matter most at each level, common objections and how to handle them, and the reporting practices that build long-term credibility.
Start with the Numbers Executives Expect
Leadership and finance leaders respond first to a small set of clear financial indicators. Present these prominently and early:
- Overall program ROI percentage
- Payback period in months
- Cumulative net value delivered to date
- Fully loaded program cost versus value generated
These figures should rest on documented baselines and transparent assumptions. Avoid presenting only projected numbers once the program is live. Actuals versus plan, updated regularly, carry far more weight.
When the numbers are strong, state them plainly. When they are still ramping, show the trajectory and the remaining path to target. Credibility comes from transparency, not from selective reporting.
Present the Full Value Picture, Not Just Cost Savings
Cost reduction is necessary but rarely sufficient. Executives also care about risk, capacity, speed, and commercial impact. Structure the narrative around the five value dimensions:
- Efficiency – cycle time and throughput gains
- Cost – unit cost reduction and labor avoided
- Quality and compliance – error reduction and risk mitigation
- Strategic capacity – hours redeployed to higher-value work
- Customer experience – service improvements linked to retention or revenue
Show how these dimensions reinforce one another. Efficiency gains often drive both cost savings and better customer outcomes. Quality improvements reduce downstream costs and compliance exposure. Strategic capacity enables initiatives that would otherwise require additional headcount.
A one-dimensional cost story leaves executives with an incomplete and less compelling picture.
Use Concrete Stories Alongside the Metrics
Numbers alone rarely persuade. Pair each major metric with a short, specific example that makes the impact tangible.
Instead of stating only that 1,200 hours were redeployed, describe what those hours now produce: a finance team that previously spent most of its time on manual reconciliations now runs weekly scenario analysis that supports faster decision-making. Instead of citing only a reduction in error rate, note the avoided rework and the cleaner audit trail that resulted.
These brief stories help non-technical leaders internalize the value and remember it when funding decisions arise.
Anticipate and Address Common Executive Concerns
Experienced leaders will probe for risks and hidden costs. Prepare concise answers on:
- Adoption and utilization rates
- Exception volumes and residual manual effort
- Ongoing maintenance and platform costs
- Scalability beyond the initial processes
- Data security, controls, and auditability
Addressing these points proactively demonstrates that the program is managed rigorously rather than sold optimistically. Including governance and control evidence, supported by strong operational practices, further strengthens the case.
Training and enablement also matter. Programs that invest in technology training and support tend to sustain higher adoption and cleaner results, which in turn make the value story more durable.
Tailor the Message to the Audience
Different stakeholders prioritize different aspects of the same data.
| Stakeholder | Primary Concerns | What Resonates Most |
| CFO / Finance | Net financial return, payback, risk | ROI %, payback period, cost vs value, controls |
| Board | Strategic alignment, competitive position | Capacity creation, risk reduction, scalability |
| Business Unit Leaders | Operational impact, service levels | Cycle time, quality, employee capacity, customer metrics |
| CIO / Technology | Architecture, maintainability, integration | Platform leverage, reuse, total cost of ownership |
A single core data set can support multiple versions of the narrative. Keep the underlying numbers consistent while emphasizing the angles each audience cares about most.
Build Credibility Through Consistent Reporting
One strong presentation is rarely enough. Establish a simple, recurring reporting rhythm—monthly or quarterly—that tracks the same core metrics over time. Show trends, not just snapshots. Highlight both successes and areas still maturing. Over time this cadence turns hyperautomation from a project update into a managed business capability.
Infrastructure and operational reliability also influence perception. Programs that rest on solid technical foundations, including thoughtful network infrastructure design and implementation, experience fewer disruptions and therefore present cleaner, more confident results.
Keep the Narrative Strategic
Ultimately, the most effective communication links hyperautomation results to the organization’s broader priorities—whether those are cost discipline, growth capacity, risk reduction, customer experience, or operational resilience. When leaders can see the direct connection between automation outcomes and the goals they are measured on, continued investment becomes a logical decision rather than a technology request.
Final Thoughts
Proving and communicating hyperautomation value to leadership, the board, and CFOs is less about technical sophistication and more about clarity, completeness, and consistency. Lead with transparent financial metrics, present the full multi-dimensional value picture, support numbers with concrete examples, address risks openly, and maintain a steady reporting rhythm. Organizations that master this communication discipline turn operational gains into sustained strategic support.
Contact us to shape a clear, executive-ready value narrative for your hyperautomation program and ensure the results receive the recognition and investment they deserve.
The standard ROI formula for hyperautomation is ROI (%) = [(Total Value Delivered − Total Program Cost) ÷ Total Program Cost] × 100. Total Value Delivered sums quantified benefits across efficiency, cost, quality, strategic capacity, and customer experience over a defined period, while Total Program Cost includes all fully loaded implementation and operating expenses.
Key Takeaways
- Use the core formula: ROI (%) = [(Total Value Delivered − Total Program Cost) ÷ Total Program Cost] × 100.
- Total Value Delivered must include all five value dimensions, not only labor savings.
- Total Program Cost should be fully loaded, covering licenses, development, infrastructure, training, change management, and maintenance.
- Always calculate payback period alongside ROI for clearer executive communication.
- Accurate baselines and consistent measurement periods are essential for credible results.
A clear, consistently applied formula is the foundation of credible hyperautomation measurement. Without it, organizations risk presenting incomplete or incomparable numbers that fail to persuade finance leaders and boards. Teams that pair the formula with disciplined tracking and strong digital marketing of internal results (through clear reporting and stakeholder communication) convert operational gains into sustained support.
This article explains the ROI formula for hyperautomation in detail, defines each component, shows how to apply it in practice, and highlights the supporting calculations that make the numbers meaningful to leadership.
The Core ROI Formula
The fundamental calculation is straightforward:
ROI (%) = [(Total Value Delivered − Total Program Cost) ÷ Total Program Cost] × 100
This formula expresses the net return as a percentage of the investment. A result of 200 percent means the program returned twice its cost in net value over the measurement period. A result of 50 percent means the net value equaled half the cost.
The power of the formula depends entirely on how completely and accurately the two main inputs are defined.
Defining Total Value Delivered
Total Value Delivered is the sum of all quantified benefits realized over the chosen measurement window, typically the first 12 to 24 months after go-live. It should draw from the full set of value dimensions:
- Efficiency value (cycle time reduction, throughput gains, straight-through processing improvements)
- Cost value (reduced cost per transaction, labor cost avoided, error correction savings)
- Quality and compliance value (error reduction, avoided penalties, audit efficiencies)
- Strategic capacity value (hours redeployed to higher-value work and the outcomes those hours produce)
- Customer experience value (improvements in satisfaction, resolution time, or service availability that can be linked to commercial results)
Omitting any of these dimensions understates the true return. The most common mistake is limiting Total Value Delivered to labor hours saved multiplied by an hourly rate. That approach ignores quality, capacity, and customer impacts that frequently exceed pure labor savings in strategic importance.
Defining Total Program Cost
Total Program Cost must be fully loaded. Include every material expense required to design, build, deploy, and operate the automation:
- Platform licensing and subscription fees
- Internal and external development or implementation costs
- Infrastructure and hosting expenses
- Training and change management
- Ongoing maintenance, support, and monitoring
- Any significant one-time integration or data preparation costs
Understating costs inflates ROI and damages credibility when finance teams later reconcile the figures. Treating one-time implementation expenses as if they recur annually also distorts the picture. Separate initial investment from run-rate costs when presenting multi-year views.
Supporting Calculation: Payback Period
ROI percentage alone does not tell leaders how quickly the investment is recovered. Always calculate payback period as well:
Payback Period (months) = Total Program Cost ÷ Average Monthly Value Delivered
This metric answers the practical question of when the program becomes cash-flow positive. High-volume process automations often achieve payback in three to six months. Broader programs typically fall in the six to twelve month range.
Practical Application Steps
- Establish rigorous baselines for volume, cycle time, error rates, and fully loaded cost per transaction before any automation goes live.
- Define the measurement period (commonly 12 months post-stabilization).
- Quantify benefits across all relevant value dimensions using consistent definitions.
- Sum the benefits to produce Total Value Delivered.
- Sum all fully loaded costs to produce Total Program Cost.
- Apply the ROI formula and the payback formula.
- Present both results together with a brief explanation of the major value drivers.
Consistency in definitions and time periods is essential. Changing how value or cost is calculated from one reporting cycle to the next undermines trust.
| Component | What to Include | Common Pitfall to Avoid |
| Total Value Delivered | Efficiency + Cost + Quality + Capacity + Experience gains | Counting only labor hours saved |
| Total Program Cost | Licenses, build, infrastructure, training, maintenance | Omitting change management or ongoing support |
| Measurement Period | Typically 12–24 months post go-live | Mixing pre-stabilization and mature periods |
| Payback Period | Total Cost ÷ Monthly Net Value | Using optimistic peak months instead of averages |
Making the Formula Credible
The mathematics are simple. Credibility comes from the quality of the inputs. Organizations that invest in clean baselines, multi-dimensional tracking, and transparent cost accounting produce ROI figures that withstand scrutiny. Those that rely on estimates, partial metrics, or incomplete cost capture produce numbers that finance teams correctly treat with skepticism.
Supporting capabilities in areas such as keyword ranking and visibility tools are less directly related, yet the broader principle of measurable, data-driven performance applies equally to internal ROI reporting. Clear, consistent measurement builds the same kind of trust internally that strong analytics build externally.
When the formula is applied rigorously and the supporting evidence is transparent, the resulting ROI percentage and payback period become powerful tools for securing continued investment and guiding prioritization decisions across the automation portfolio.
Final Thoughts
The ROI formula for hyperautomation is simple in structure yet demanding in execution. Success depends on capturing the full range of value delivered and the complete cost of the program, then applying the calculation consistently over a meaningful period. Organizations that treat the formula as a discipline rather than a one-time exercise generate numbers that leadership trusts and acts upon.
Contact us to apply the ROI formula to your current or planned hyperautomation initiatives and build a measurement approach that produces clear, defensible results.
The most common mistakes when measuring hyperautomation ROI include failing to establish a rigorous baseline before go-live, tracking only labor cost savings, ignoring compounding effects and redeployment value, using inconsistent metric definitions, and underestimating total program costs. These errors systematically understate or overstate returns and erode credibility with leadership.
Key Takeaways
- Skipping the baseline makes later value claims unprovable.
- Measuring only labor savings ignores efficiency, quality, capacity, and customer experience gains.
- Point-in-time snapshots miss compounding improvements from learning models and reusable components.
- Incomplete cost tracking and weak adoption monitoring distort both ROI and payback calculations.
- Inconsistent definitions and selective reporting destroy trust with finance and board stakeholders.
Accurate measurement is the difference between a hyperautomation program that secures ongoing investment and one that stalls after the initial pilot. Many organizations invest heavily in the technology yet undermine their own results through avoidable measurement errors. Teams that combine strong delivery discipline with structured technology training and support services reduce the likelihood of these mistakes and produce numbers that withstand scrutiny.
This article identifies the most frequent and damaging mistakes in measuring hyperautomation ROI, explains why each one occurs, and outlines practical ways to avoid them.
Mistake 1: Launching Without a Rigorous Baseline
The single most damaging error is starting automation without documenting the current state. Without clear pre-automation figures for volume, cycle time, error rates, cost per transaction, and employee time allocation, there is no credible reference point. Later claims of improvement become estimates rather than evidence.
This mistake is common because baseline work feels like delay. In reality it is the only way to prove value six or twelve months later when leadership asks what the program has delivered. Organizations that skip it routinely struggle to defend continued funding.
Mistake 2: Tracking Only Labor Cost Savings
Many ROI models reduce everything to hours saved multiplied by an hourly rate. This approach captures only one slice of value and systematically understates returns.
Hyperautomation also improves speed, accuracy, compliance posture, employee capacity for higher-value work, and customer experience. When these dimensions are omitted, the resulting ROI figure is incomplete and less persuasive. Finance leaders may accept the labor number yet still question whether the broader strategic case is strong enough.
Mistake 3: Ignoring Compounding Effects
Value from hyperautomation often grows after go-live. Machine learning models improve with production data. Process mining surfaces new opportunities. Reusable components accelerate later automations. Measurement frameworks that look only at the first three or six months miss this trajectory.
The result is an artificially low view of program performance. Organizations that measure trends over 12 to 24 months see a more accurate and usually more favorable picture.
Mistake 4: Underestimating or Misclassifying Total Program Cost
Incomplete cost tracking is as damaging as incomplete value tracking. Common errors include omitting change management, training, ongoing maintenance, infrastructure, or internal governance effort. Another frequent issue is treating one-time implementation costs as if they recur every year, which distorts multi-year ROI.
Fully loaded, transparent cost accounting is essential for credibility. When finance teams later discover missing expenses, trust in the entire measurement system declines.
Mistake 5: Weak Adoption and Exception Tracking
Projected ROI assumes high utilization and low exception rates. In practice, automations that launch with incomplete change management or unclear exception handling often run well below design capacity. If utilization and exception volumes are not monitored, the gap between projected and actual value remains hidden until it is too late to correct course.
Regular tracking of bot utilization, straight-through processing rates, and exception volumes is required to keep ROI calculations grounded in reality.
Mistake 6: Inconsistent Metric Definitions and Selective Reporting
When different teams define cycle time, error rate, or cost per transaction differently, or when definitions change between reporting periods, comparability collapses. Selective highlighting of favorable numbers while downplaying shortfalls further erodes credibility.
A stable, documented set of definitions and a balanced reporting approach that includes both successes and areas still maturing are essential for sustained trust.
| Common Mistake | Why It Damages Credibility | How to Avoid It |
| No pre-automation baseline | Claims become unprovable | Document volume, time, errors, and cost before go-live |
| Only labor cost savings | Understates true multi-dimensional value | Track all five value dimensions |
| Ignoring compounding effects | Early snapshots undervalue long-term gains | Measure trends over 12–24 months |
| Incomplete or misclassified costs | Inflates ROI and invites later challenge | Use fully loaded, transparent cost accounting |
| Weak adoption / exception monitoring | Projected benefits never fully materialize | Track utilization and exception rates continuously |
| Inconsistent definitions / selective reporting | Destroys comparability and trust | Standardize metrics and report balanced results |
Building a Measurement Practice That Avoids These Pitfalls
Organizations that consistently produce credible ROI figures treat measurement as a design requirement rather than a reporting afterthought. They establish baselines before any automation begins. They define a balanced scorecard covering efficiency, cost, quality, strategic capacity, and customer experience. They track adoption and exceptions as leading indicators. They apply consistent definitions over time. And they present both the ROI percentage and the payback period with transparent supporting detail.
Strong supporting practices in areas such as network infrastructure design and implementation help ensure the technical foundation remains stable, reducing noise in the operational data that feeds ROI calculations. Clear governance and audit-ready evidence further strengthen the case when results are reviewed by finance or the board.
Avoiding the common mistakes is less about sophisticated mathematics and more about discipline, completeness, and transparency. Programs that embed these habits from the start turn measurement from a vulnerability into a strategic advantage.
Final Thoughts
Most hyperautomation ROI problems are self-inflicted. Missing baselines, narrow metrics, incomplete costs, and weak adoption tracking turn strong operational results into weak or contested numbers. Organizations that eliminate these mistakes produce clear, defensible evidence of value and earn the continued investment required to scale.
Contact us to review your current measurement approach, identify any gaps, and put a robust, credible ROI framework in place for your hyperautomation program.